During the previous trading session, the price of Ethereum decreased, moving in the main trend direction on the higher time-frame.
The support and resistance levels:
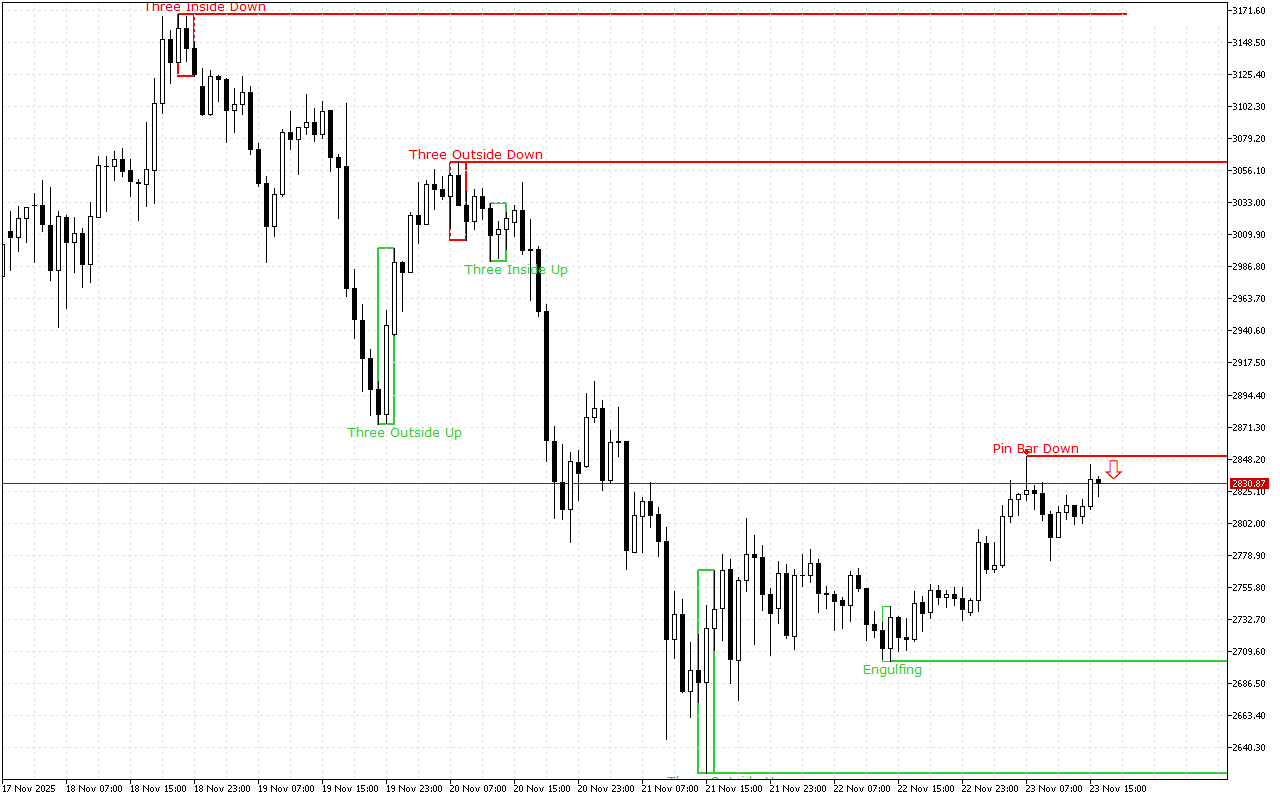
The support level is near the 2702.59 mark.
This level was formed by the Bullish Engulfing pattern. The pattern consists of two candles: the first one is inside the body of the second one, which is much larger. The second candle completely engulfs the first one.
The resistance level is near the 2850.43 mark.
This level was formed by a Pin Bar pattern. This pattern is presented with a single Japanese candle with a small real body and a long upper shadow. This is one of the key patterns in the Price Action system.
Trading recommendations:
The latest pattern formed on the chart prioritizes short positions. This signal is also proved with the price movement dynamics on the higher time-frame.