During the previous trading session, the positive dynamics of the GBPUSD movement were seen. On a longer time-frame, the upward price movement vector also prevails.
The support and resistance levels:
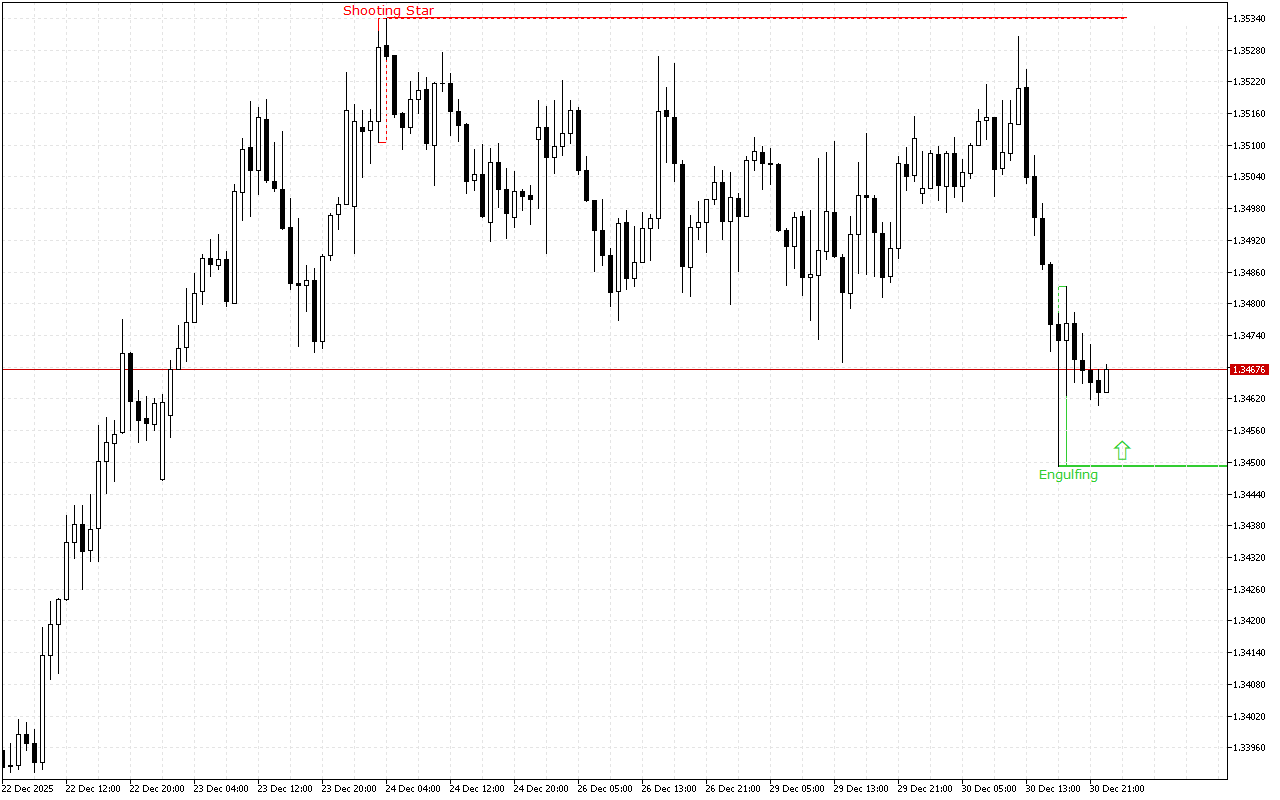
The closest support to the price is at the 1.34493 mark.
This level was formed by the Bullish Engulfing pattern. The pattern consists of two candles: the first one is inside the body of the second one, which is much larger. The second candle completely engulfs the first one.
The nearest resistance level is at the level of the 1.35339.
The level was formed by the Shooting Star pattern. This pattern is a single candlestick which is composed of a small real body and a long upper shadow. This pattern is usually called “Pin Bar” by traders.
Trading recommendations:
The price movement dynamics for a longer period of time as well as the latest signals on the chart indicate the long positions opening intraday. The entry points can be considered from the nearest support levels.