During the previous trading session, S&P 500 demonstrated downward dynamics. On a longer time-frame, the upward trend still prevails.
The support and resistance levels:
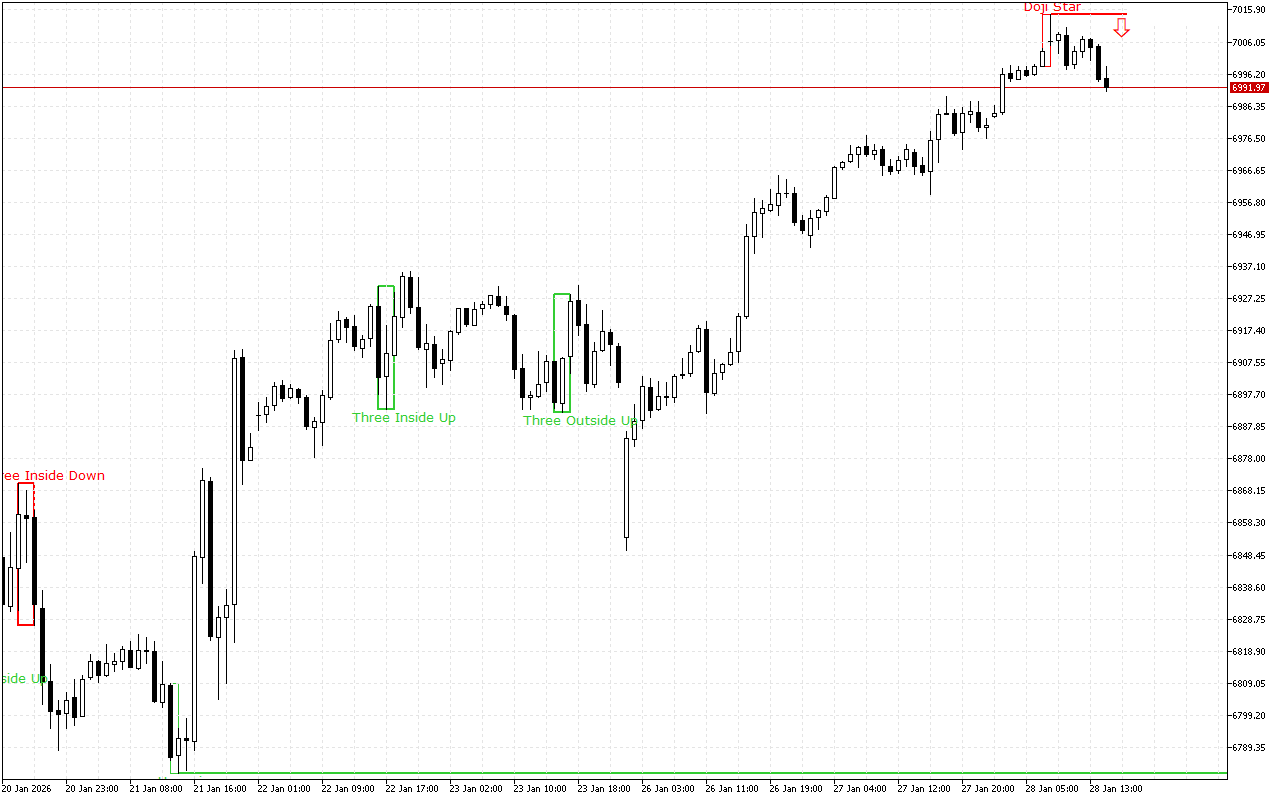
The nearest support is set at the 6781.38 mark.
This level was formed by the Bullish Harami pattern. The pattern is represented with two Japanese candles, where the second one with a smaller real body is inside the body of the first one.
The nearest resistance is set at the 7014.44 mark.
This level is formed by the Bearish Doji Star pattern. This pattern has a fairly high confirmation rate. It consists of two Japanese candles, where the second is a doji, which opens with a gap down.
Trading recommendations:
The latest signal prioritizes short positions intraday.