During the previous trading session, S&P 500 demonstrated downward dynamics. On a longer time-frame, the upward trend still prevails.
The support and resistance levels:
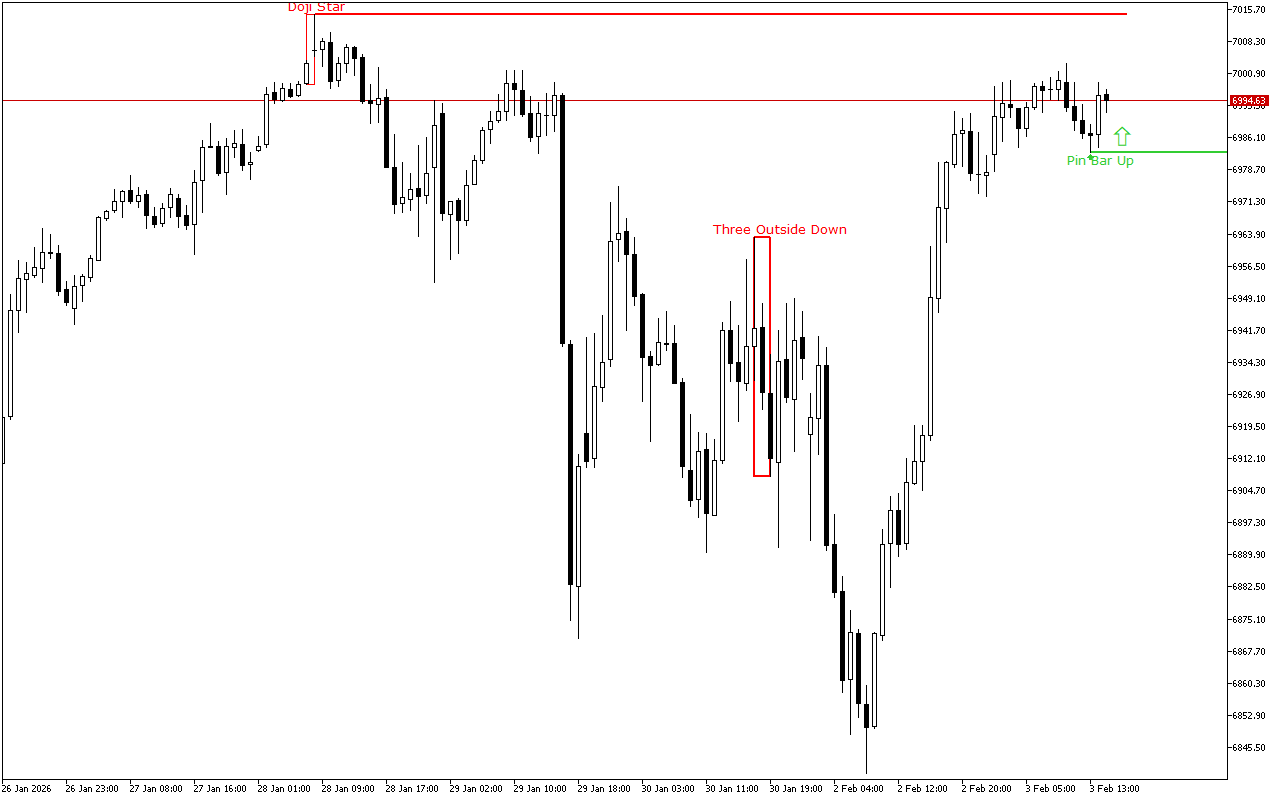
The support level is near the 6982.75 mark.
This level is formed due to the appearance of the Pin Bar pattern. This pattern is represented with a candle with a small real body and a long lower shadow. This pattern is quite common at strong support levels.
The resistance level is near the 7014.44 mark.
This level is formed by the Bearish Doji Star pattern. This pattern has a fairly high confirmation rate. It consists of two Japanese candles, where the second is a doji, which opens with a gap down.
Trading recommendations:
The price movement dynamics for a longer period of time as well as the latest signals on the chart indicate the long positions opening intraday. The entry points can be considered from the nearest support levels.