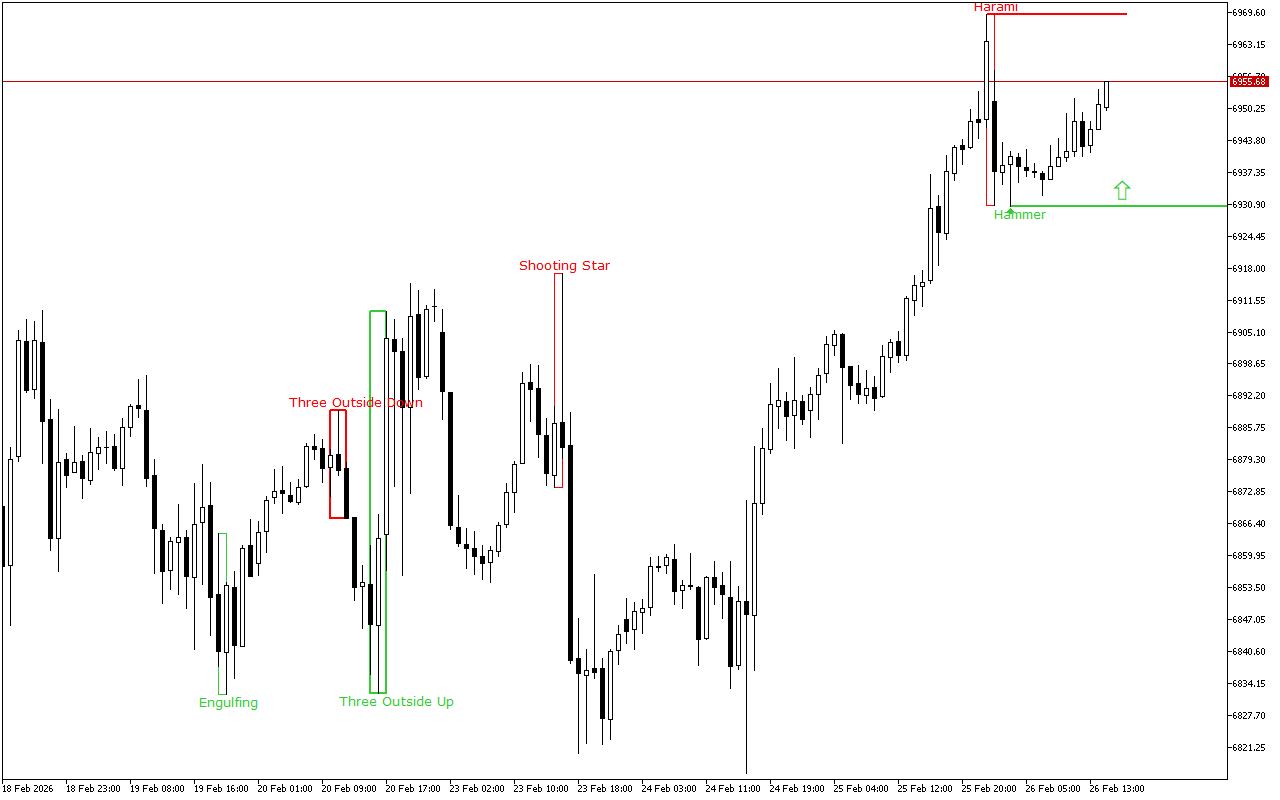
During the previous trading session, S&P 500 demonstrated downward dynamics. On a longer time-frame, the upward trend still prevails.
The support and resistance levels:
The support level is near the 6930.46 mark.
This level was formed by the Hammer pattern, also known as the Pin Bar pattern. This pattern is represented with a single Japanese candlestick which is composed of a small real body and a long lower shadow.
The resistance level is near the 6969.16 mark.
This level was formed by the Bearish Harami pattern, which is presented with two Japanese candlesticks where the second candlestick with a smaller real body is inside the body of the first one.
Trading recommendations:
On the higher time-frame, the upward price dynamics prevail. The last signal on the chart also indicates the upcoming growth. Against this background, it is worth prioritizing the buy signals during the day.