During the previous trading session, the price of S&P 500 decreased, moving in the main trend direction on the higher time-frame.
The support and resistance levels:
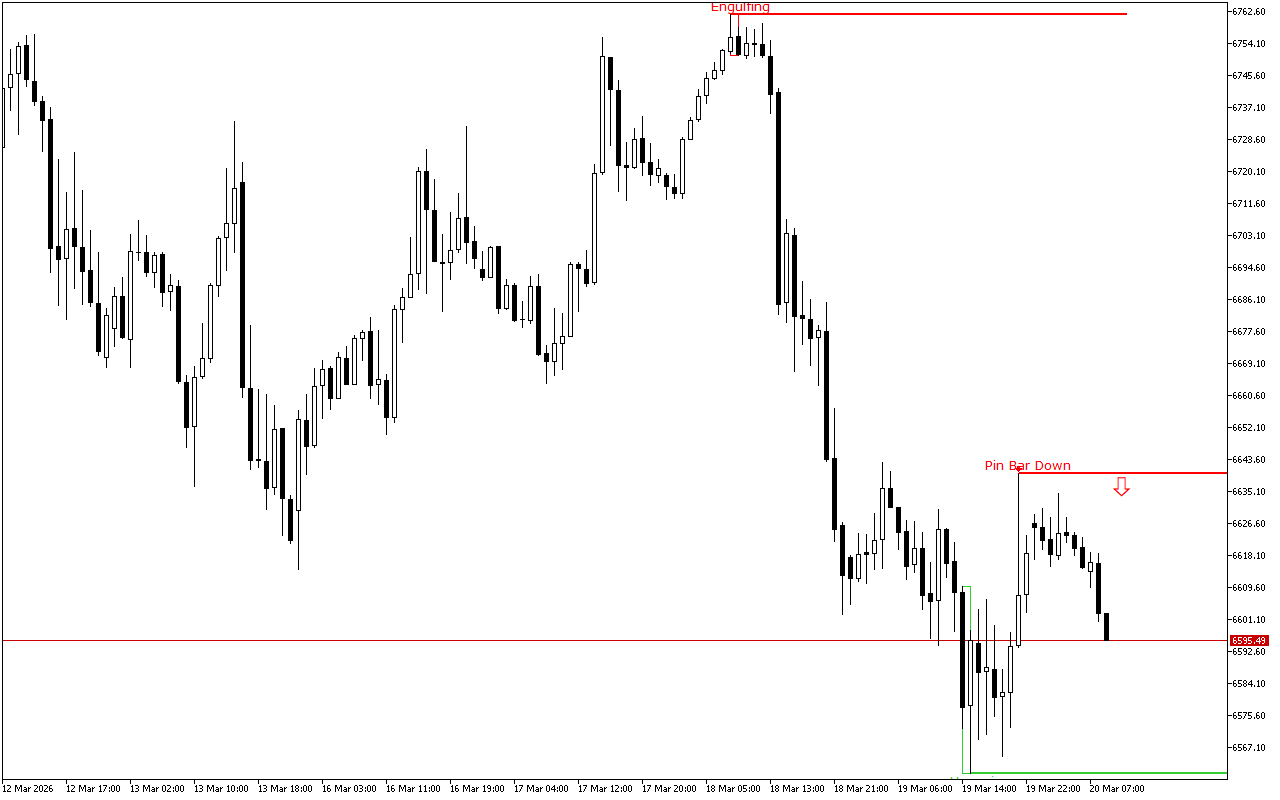
The support level is near the 6560.25 mark.
This level was formed by the Bullish Harami pattern. The pattern is represented with two Japanese candles, where the second one with a smaller real body is inside the body of the first one.
The resistance level is near the 6640 mark.
This level was formed by a Pin Bar pattern. This pattern is presented with a single Japanese candle with a small real body and a long upper shadow. This is one of the key patterns in the Price Action system.
Trading recommendations:
During the day, it is worth considering the possibilities for opening short positions. This is indicated by both: the dynamics of price movement over a longer distance and the latest formed pattern.