S&P 500 closes the last trading session in the green zone, while the downward price movement vector prevails on the higher time-frame.
The support and resistance levels:
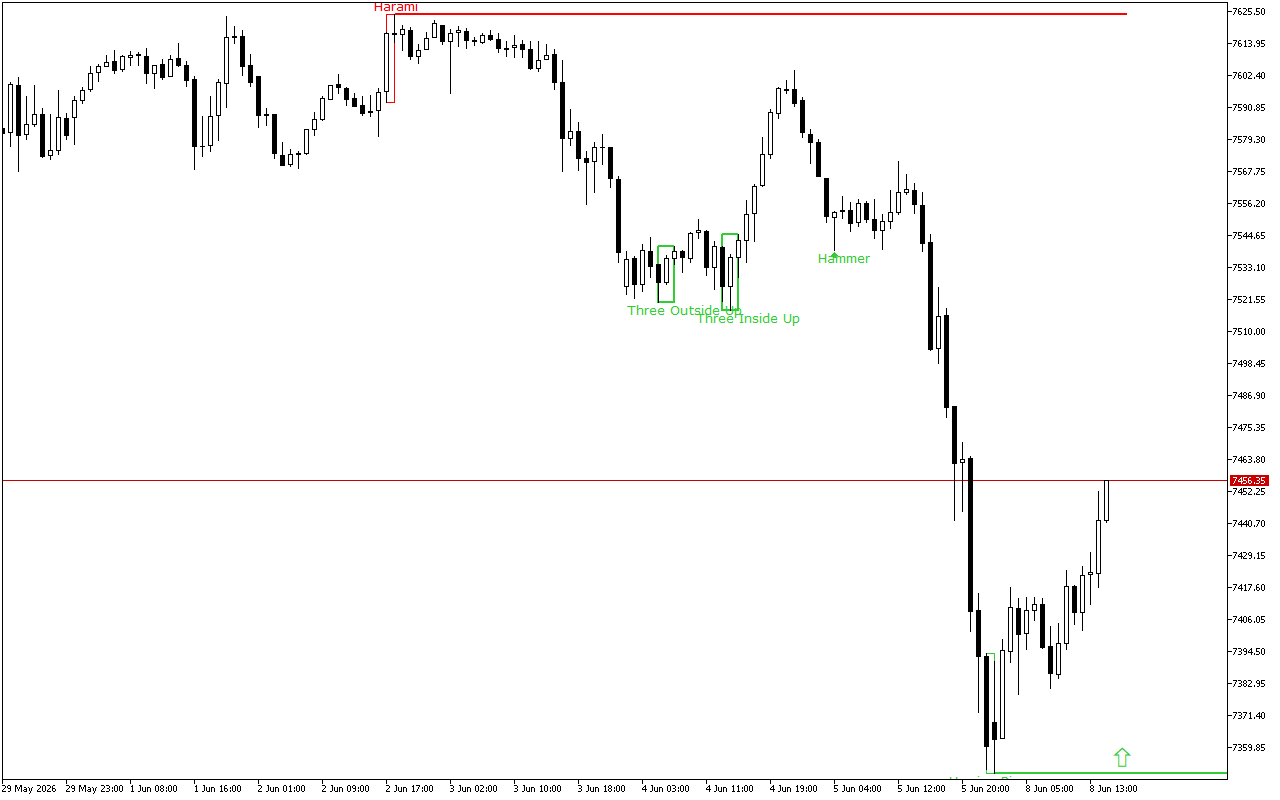
The nearest support is set at the 7350.48 mark.
The indicated level was formed by the Bullish Homing Pigeon pattern. In this pattern, the first candle has a long black body and the second one has a white body. The opening of the second candle is close to the closing of the first one.
The nearest resistance is set at the 7624.41 mark.
This level was formed by the Bearish Harami pattern, which is presented with two Japanese candlesticks where the second candlestick with a smaller real body is inside the body of the first one.
Trading recommendations:
The latest signal on the chart indicates the prevalence of the long positions. This signal is valid, until the other pattern is formed.