During the previous trading session, the positive dynamics of the S&P 500 movement were seen. On a longer time-frame, the upward price movement vector also prevails.
The support and resistance levels:
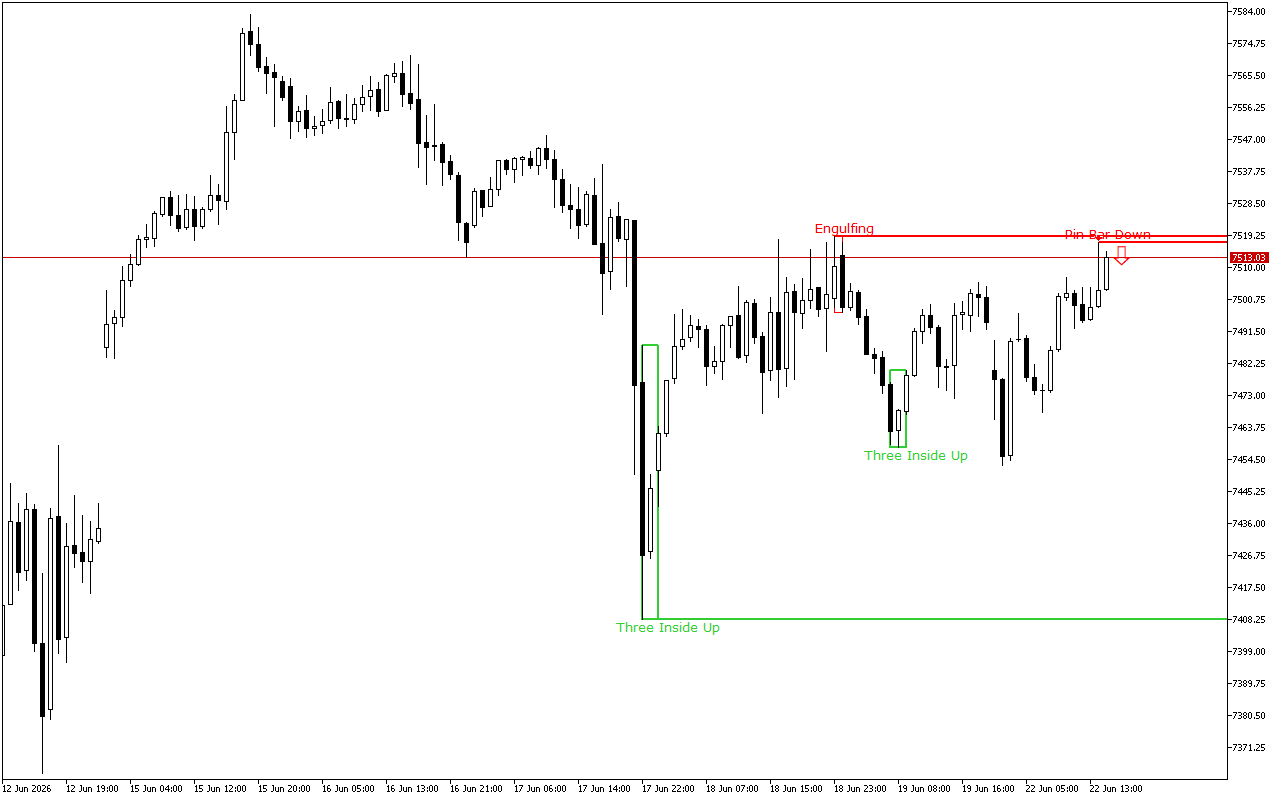
The closest support to the price is at the 7408.32 mark.
The nearest resistance level is at the level of the 7517.28.
This level was formed by a Pin Bar pattern. This pattern is presented with a single Japanese candle with a small real body and a long upper shadow. This is one of the key patterns in the Price Action system.
Trading recommendations:
The upward dynamics prevail on a longer time period, but the short positions should be prioritized during the day because the latest signal suggests a dominant downward movement.