During the previous trading session, the price of S&P 500 decreased, moving in the main trend direction on the higher time-frame.
The support and resistance levels:
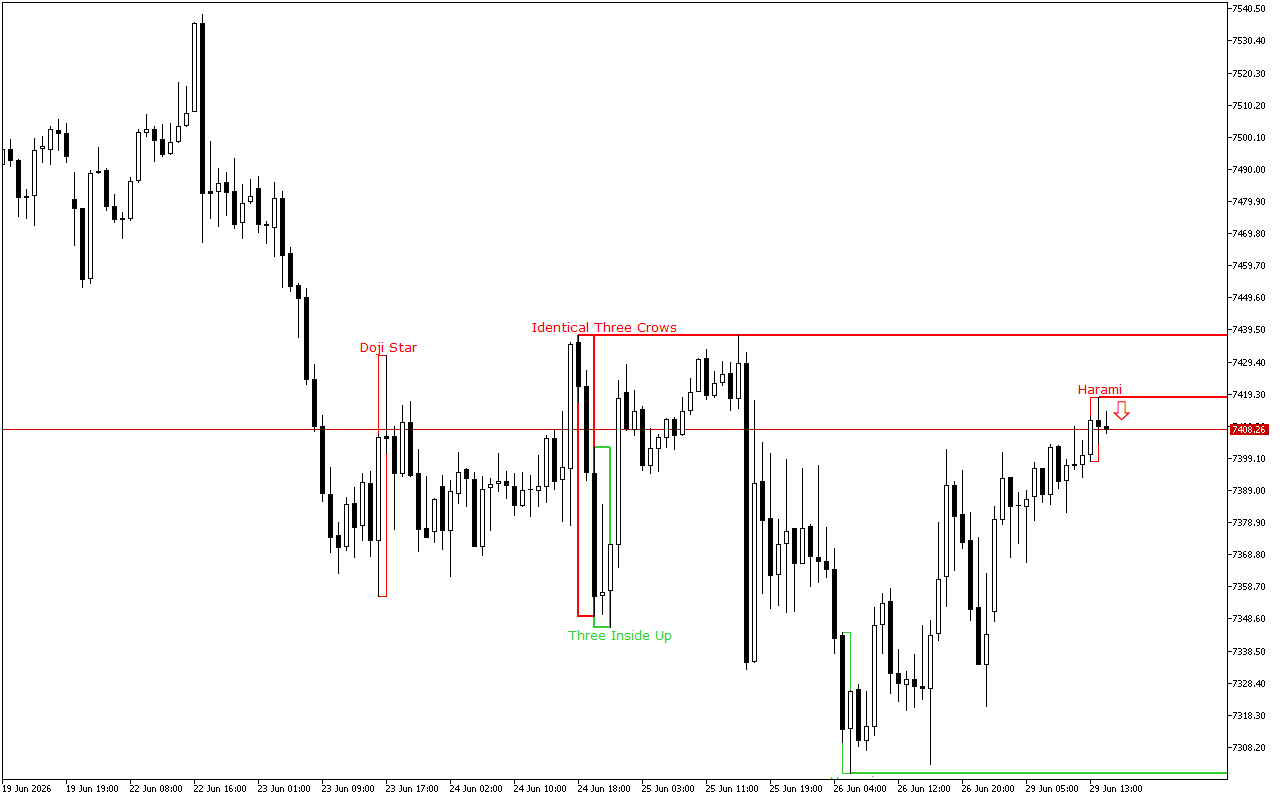
The current support level is in the area of the 7300.07 mark.
This level was formed by the Bullish Harami pattern. The pattern is represented with two Japanese candles, where the second one with a smaller real body is inside the body of the first one.
The current resistance level is at the 7418.33 mark.
This level was formed by the Bearish Harami pattern, which is presented with two Japanese candlesticks where the second candlestick with a smaller real body is inside the body of the first one.
Trading recommendations:
The latest pattern formed on the chart prioritizes short positions. This signal is also proved with the price movement dynamics on the higher time-frame.