During the previous trading session, Ethereum demonstrated downward dynamics. On a longer time-frame, the upward trend still prevails.
The support and resistance levels:
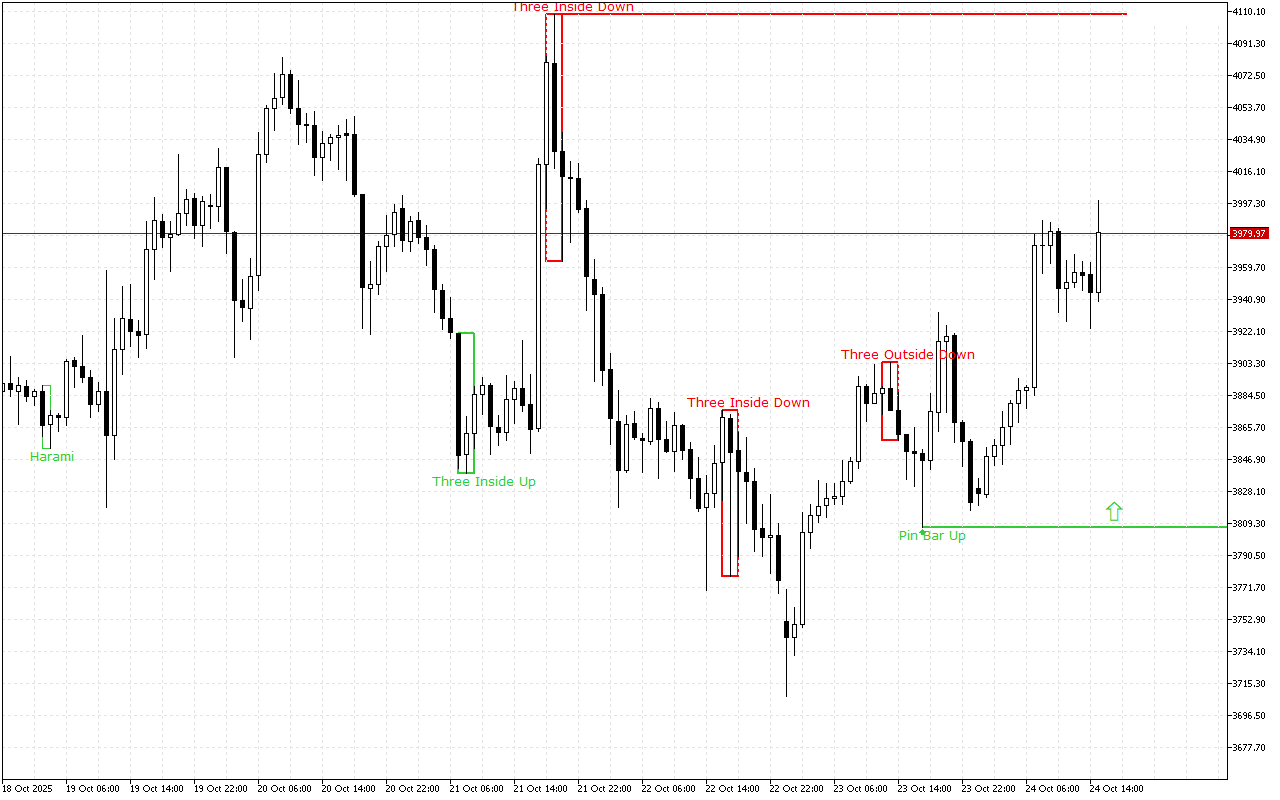
The nearest support level is at the price level of the 3807.01.
This level is formed due to the appearance of the Pin Bar pattern. This pattern is represented with a candle with a small real body and a long lower shadow. This pattern is quite common at strong support levels.
The nearest significant resistance level is at the 4108.31 mark.
Trading recommendations:
The price movement dynamics for a longer period of time as well as the latest signals on the chart indicate the long positions opening intraday. The entry points can be considered from the nearest support levels.