Ethereum closes the last trading session in the green zone, while the downward price movement vector prevails on the higher time-frame.
The support and resistance levels:
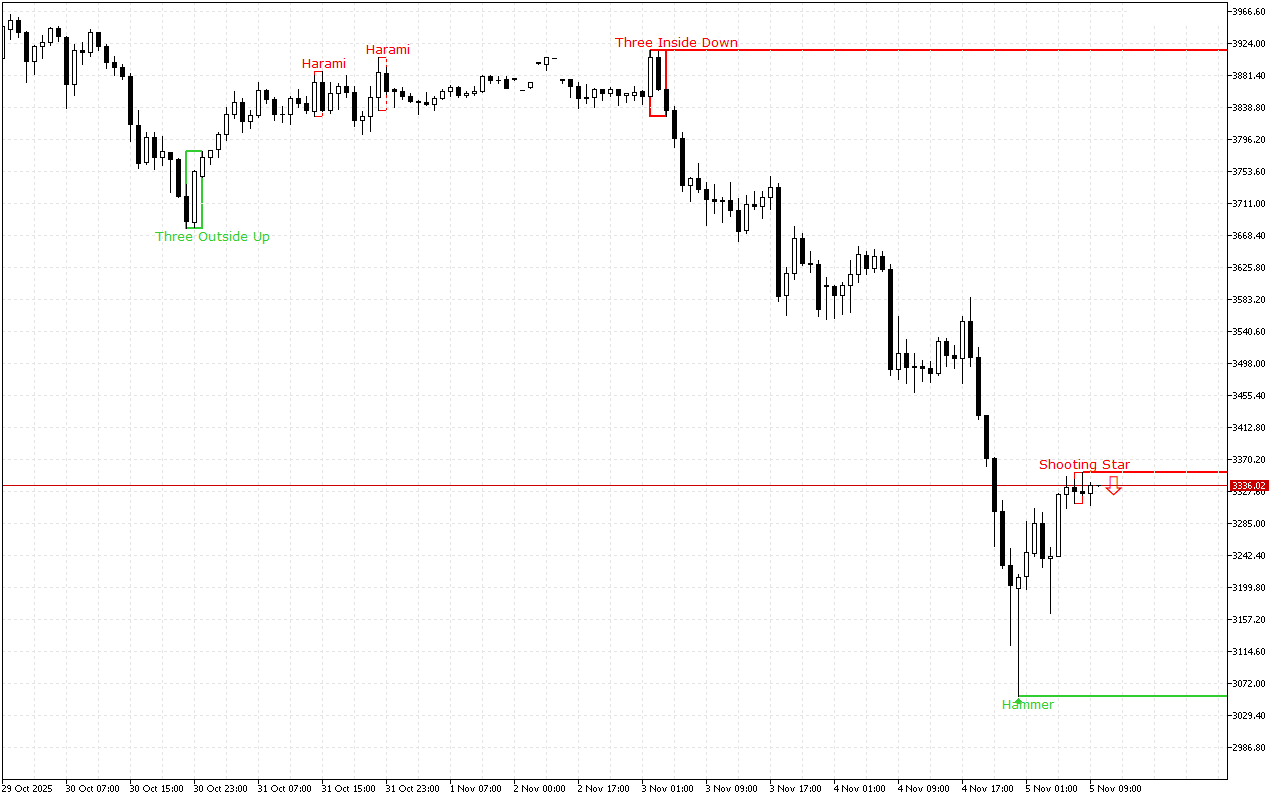
The closest support to the price is at the 3054.72 mark.
This level was formed by the Hammer pattern, also known as the Pin Bar pattern. This pattern is represented with a single Japanese candlestick which is composed of a small real body and a long lower shadow.
The nearest resistance level is at the level of the 3352.12.
The level was formed by the Shooting Star pattern. This pattern is a single candlestick which is composed of a small real body and a long upper shadow. This pattern is usually called “Pin Bar” by traders.
Trading recommendations:
The latest pattern formed on the chart prioritizes short positions. This signal is also proved with the price movement dynamics on the higher time-frame.