During the previous trading session, the positive dynamics of the S&P 500 movement were seen. On a longer time-frame, the upward price movement vector also prevails.
The support and resistance levels:
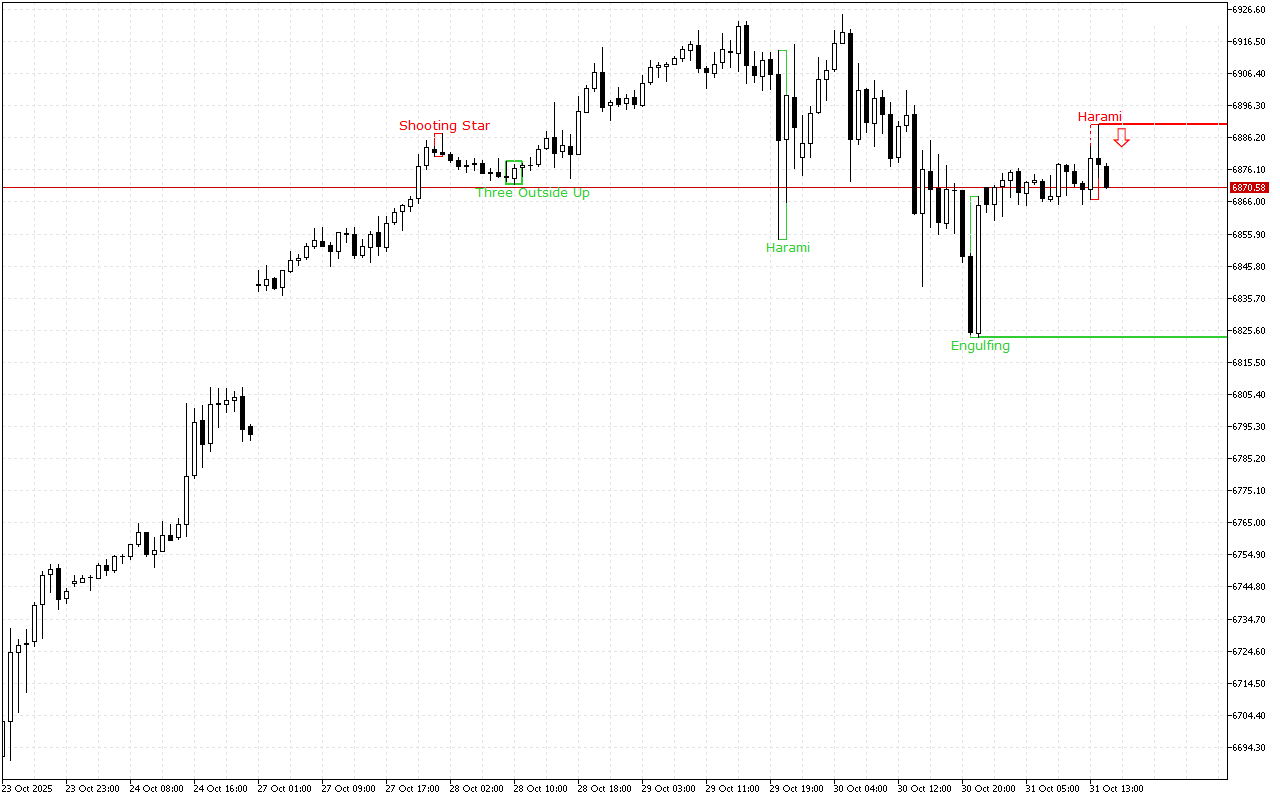
The closest support to the price is at the 6823.22 mark.
This level was formed by the Bullish Engulfing pattern. The pattern consists of two candles: the first one is inside the body of the second one, which is much larger. The second candle completely engulfs the first one.
The nearest resistance level is at the level of the 6890.33.
This level was formed by the Bearish Harami pattern, which is presented with two Japanese candlesticks where the second candlestick with a smaller real body is inside the body of the first one.
Trading recommendations:
The upward dynamics prevail on a longer time period, but the short positions should be prioritized during the day because the latest signal suggests a dominant downward movement.