Ethereum closes the last trading session in the green zone, while the downward price movement vector prevails on the higher time-frame.
The support and resistance levels:
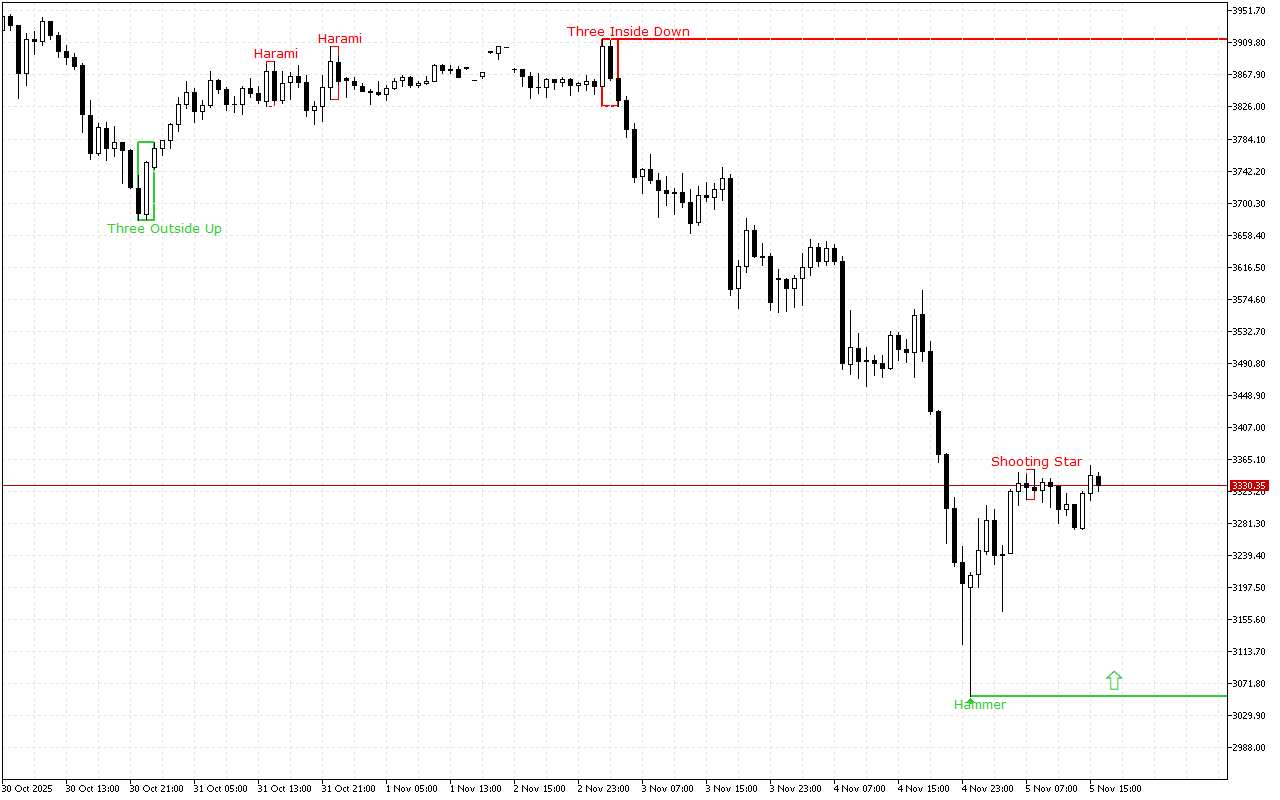
The closest support to the price is at the 3054.72 mark.
This level was formed by the Hammer pattern, also known as the Pin Bar pattern. This pattern is represented with a single Japanese candlestick which is composed of a small real body and a long lower shadow.
The nearest resistance level is at the level of the 3914.45.
This level was formed by the Three Inside Down pattern. This pattern consists of three Japanese candles: the first candle has a short black real body, the second candle also has a black real body and is completely inside the body of the first candle, and the third candle is also black and closes below the body of the second candle.
Trading recommendations:
Despite the downward dynamics prevail on a higher time-frame, the long position should be prioritized intraday. The latest signal on the chart indicates the prevalence of the upward movement intraday.