During the previous trading session, the positive dynamics of the Ethereum movement were seen. On a longer time-frame, the upward price movement vector also prevails.
The support and resistance levels:
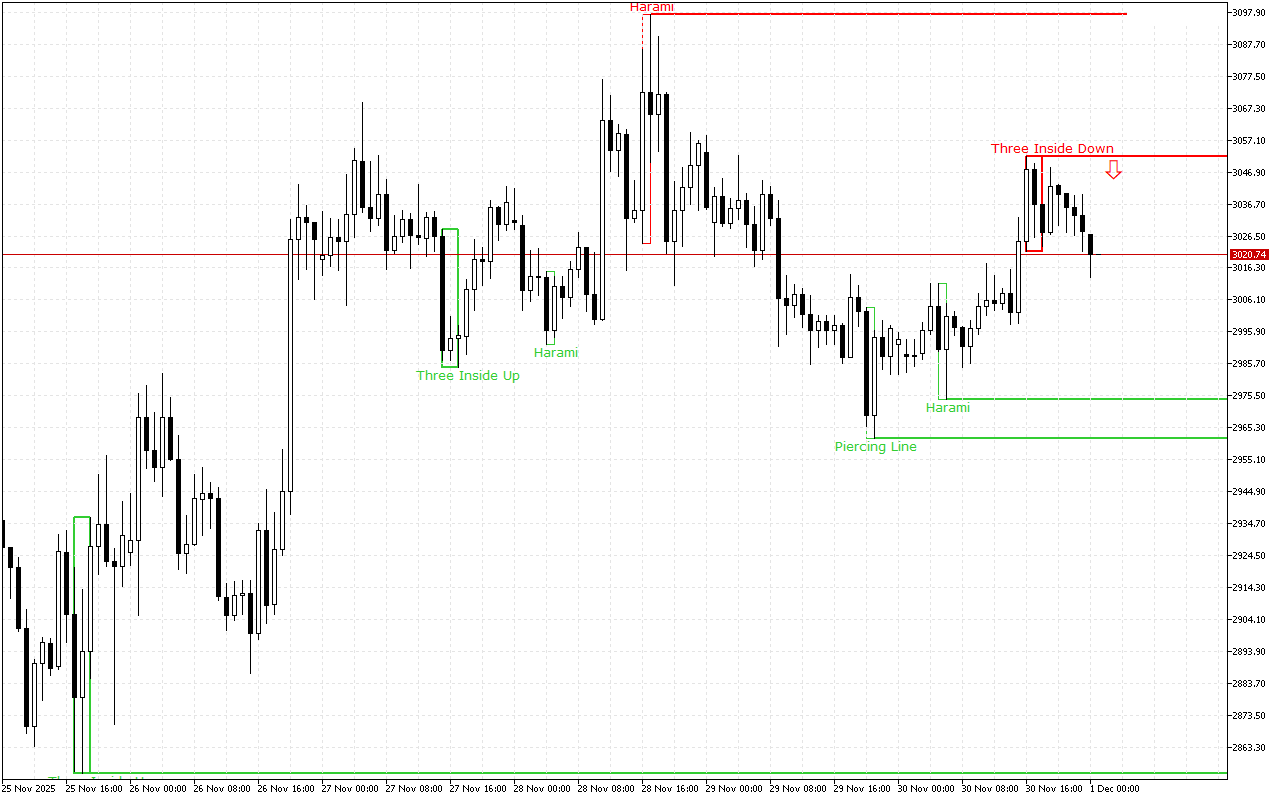
The current support level is in the area of the 2974.45 mark.
This level was formed by the Bullish Harami pattern. The pattern is represented with two Japanese candles, where the second one with a smaller real body is inside the body of the first one.
The current resistance level is at the 3051.88 mark.
This level was formed by the Three Inside Down pattern. This pattern consists of three Japanese candles: the first candle has a short black real body, the second candle also has a black real body and is completely inside the body of the first candle, and the third candle is also black and closes below the body of the second candle.
Trading recommendations:
The latest signal prioritizes short positions intraday.