During the previous trading session, the positive dynamics of the Ethereum movement were seen. On a longer time-frame, the upward price movement vector also prevails.
The support and resistance levels:
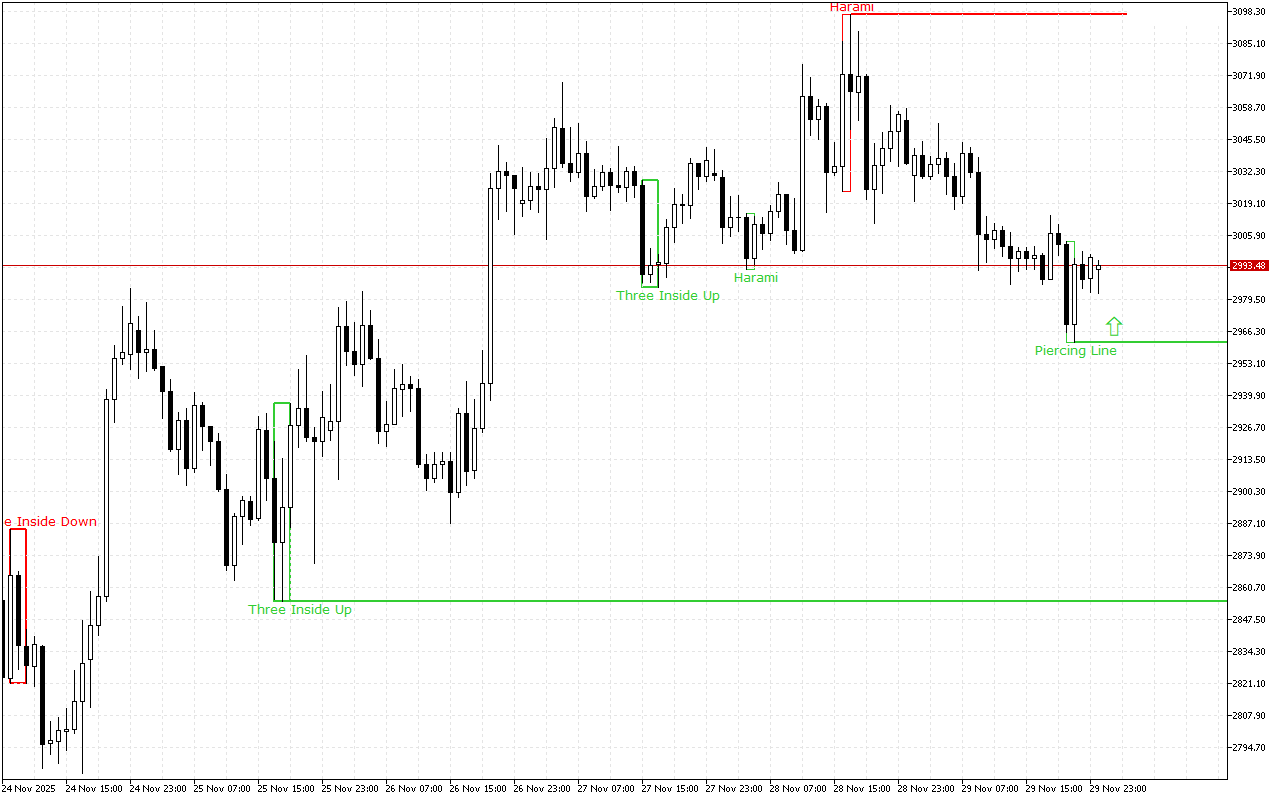
The current support level is in the area of the 2961.76 mark.
The Penetrating Line pattern formed this level. The pattern consists of two candles: the first one has a long black body, the second one has a white body. The second candle opens with a gap down and closes above the middle of the first candle’s body.
The current resistance level is at the 3097.12 mark.
This level was formed by the Bearish Harami pattern, which is presented with two Japanese candlesticks where the second candlestick with a smaller real body is inside the body of the first one.
Trading recommendations:
The price movement dynamics for a longer period of time as well as the latest signals on the chart indicate the long positions opening intraday. The entry points can be considered from the nearest support levels.