During the previous trading session, the positive dynamics of the GBPUSD movement were seen. On a longer time-frame, the upward price movement vector also prevails.
The support and resistance levels:
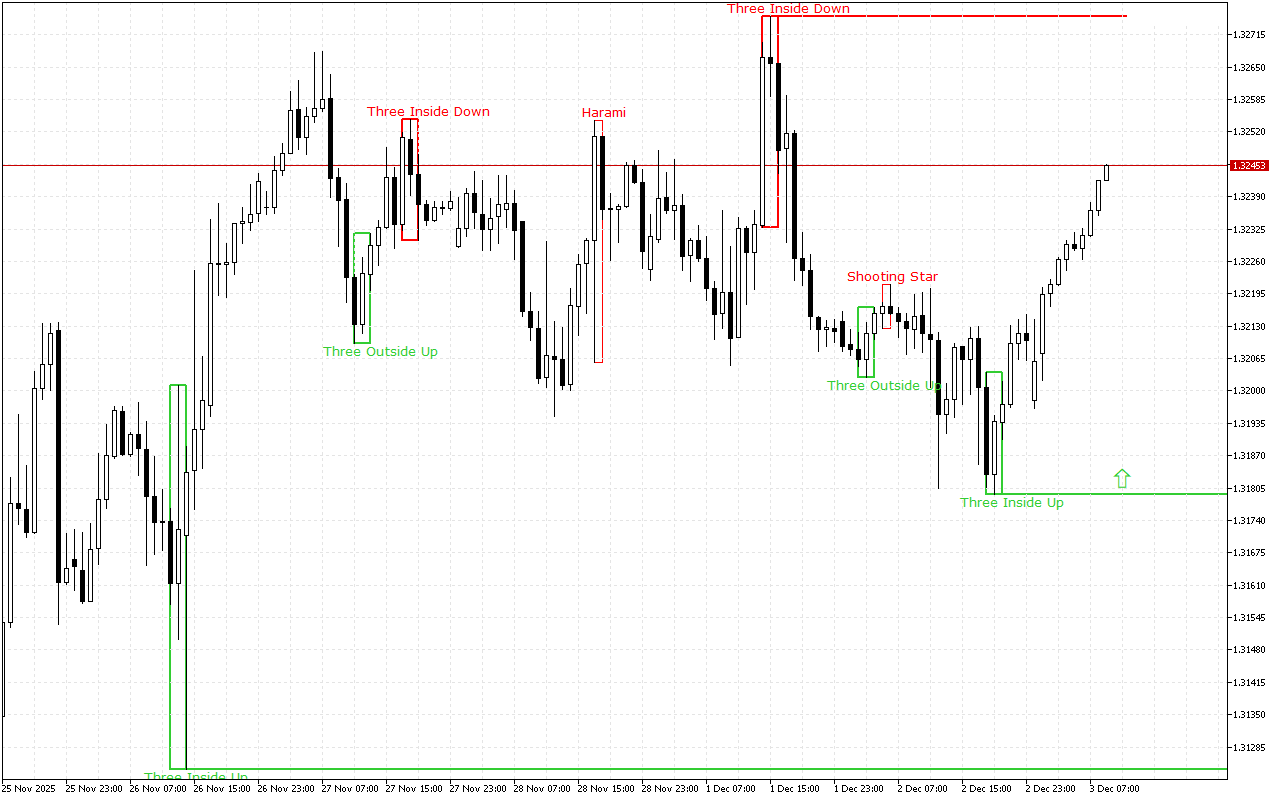
The support level is near the 1.31793 mark.
This level was formed by the Three Inside Up pattern. This pattern consists of three Japanese candles: the first candle has a short white real body, the second candle has a white real body and is completely inside the body of the first candle, and the third candle is also white and closes above the body of the second candle.
The resistance level is near the 1.32751 mark.
This level was formed by the Three Inside Down pattern. This pattern consists of three Japanese candles: the first candle has a short black real body, the second candle also has a black real body and is completely inside the body of the first candle, and the third candle is also black and closes below the body of the second candle.
Trading recommendations:
The price movement dynamics for a longer period of time as well as the latest signals on the chart indicate the long positions opening intraday. The entry points can be considered from the nearest support levels.