During the previous trading session, S&P 500 demonstrated downward dynamics. On a longer time-frame, the upward trend still prevails.
The support and resistance levels:
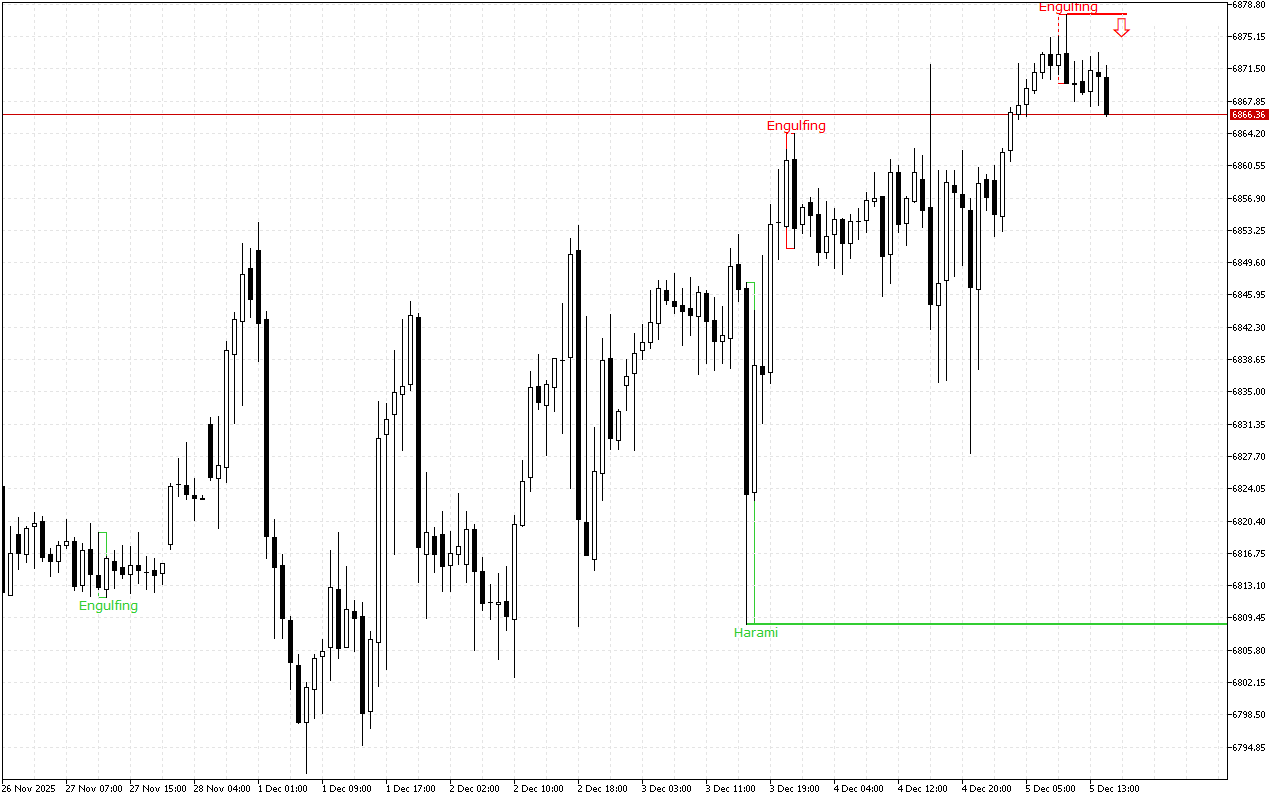
The nearest support level is at the price level of the 6808.66.
This level was formed by the Bullish Harami pattern. The pattern is represented with two Japanese candles, where the second one with a smaller real body is inside the body of the first one.
The nearest significant resistance level is at the 6877.61 mark.
The Bearish Engulfing pattern formed this level. It consists of two Japanese candles: the first candle is located inside the body of the second candle.
Trading recommendations:
The upward dynamics prevail on a longer time period, but the short positions should be prioritized during the day because the latest signal suggests a dominant downward movement.