During the previous trading session, the price of S&P 500 decreased, moving in the main trend direction on the higher time-frame.
The support and resistance levels:
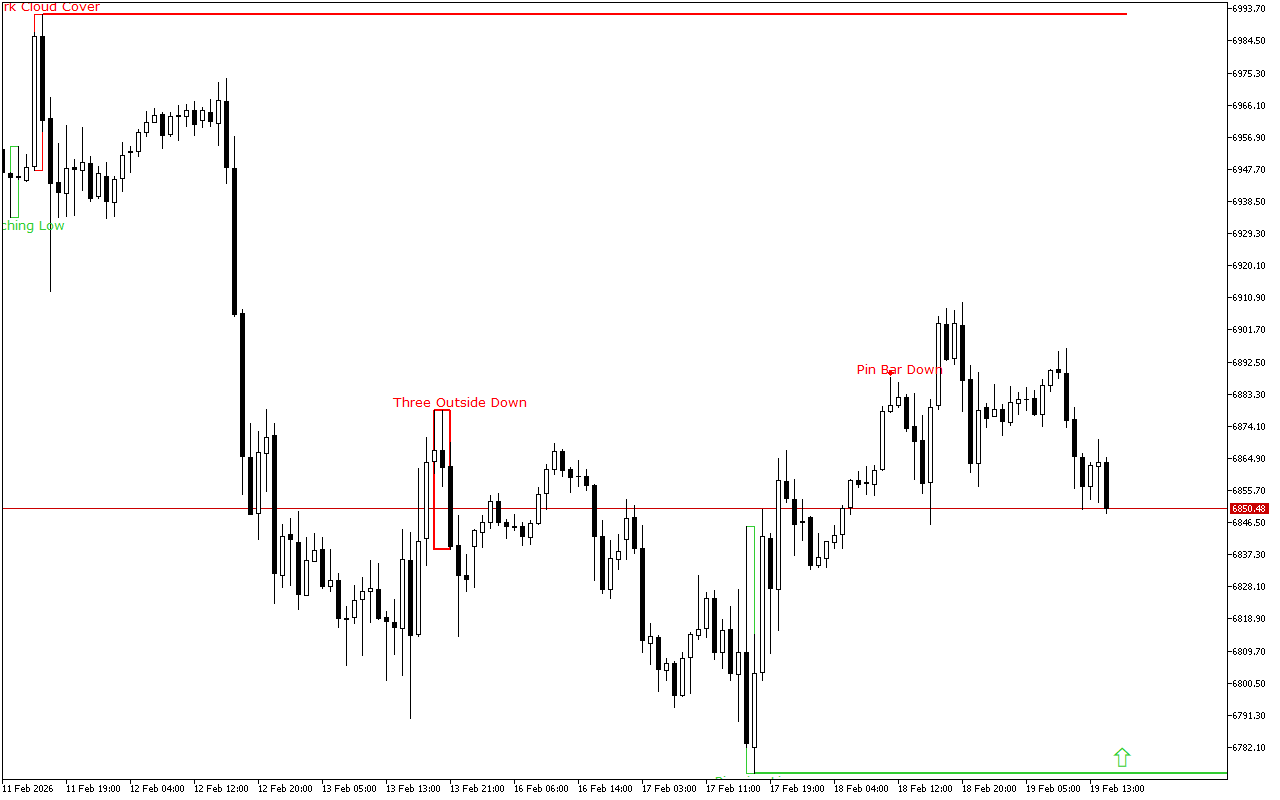
The support level is near the 6774.63 mark.
The Penetrating Line pattern formed this level. The pattern consists of two candles: the first one has a long black body, the second one has a white body. The second candle opens with a gap down and closes above the middle of the first candle’s body.
The resistance level is near the 6992.02 mark.
This level was formed by the Dark Cloud Cover pattern. The pattern consists of two candles: the first candle is long and white, and the second is black. The second one opens with a gap up and closes below the middle of the real body of the first candle.
Trading recommendations:
The latest signal on the chart indicates the prevalence of the long positions. This signal is valid, until the other pattern is formed.