During the previous trading session, the price of S&P 500 decreased, moving in the main trend direction on the higher time-frame.
The support and resistance levels:
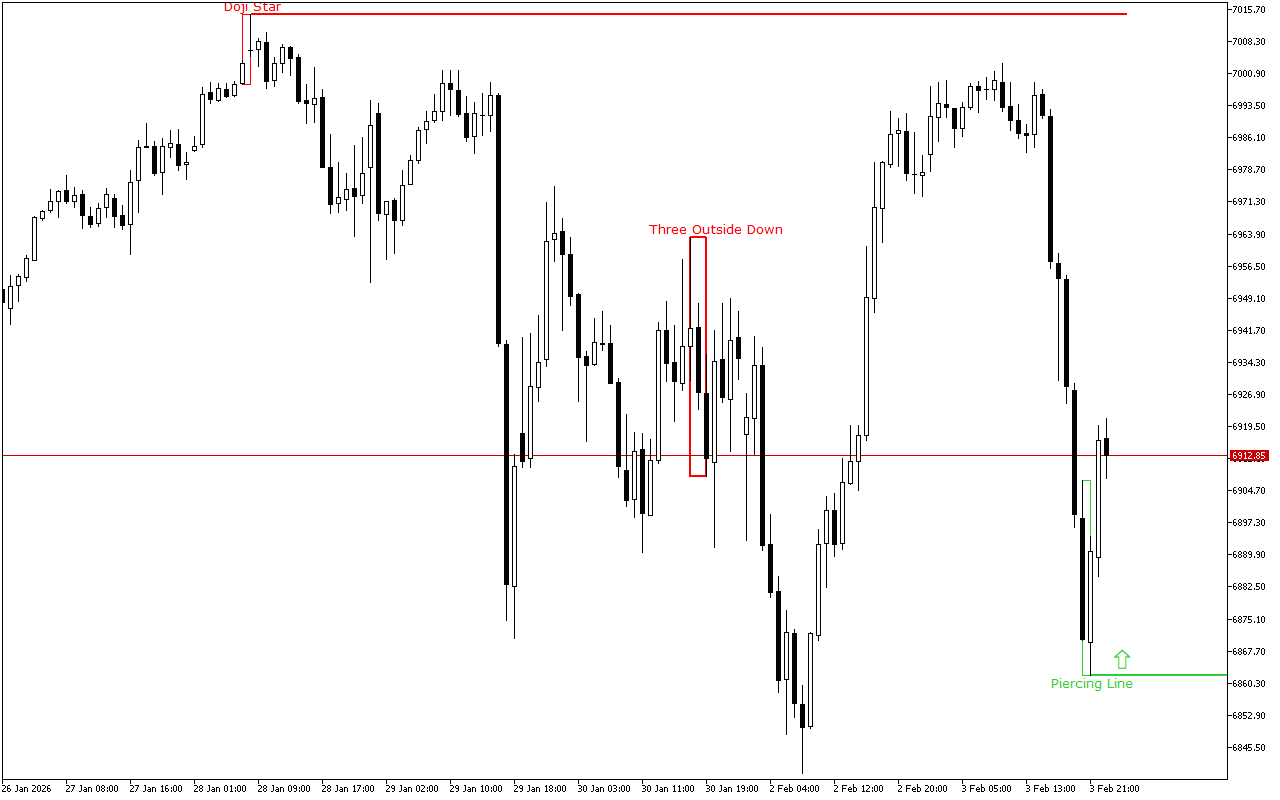
The nearest support level is at the price level of the 6862.13.
The Penetrating Line pattern formed this level. The pattern consists of two candles: the first one has a long black body, the second one has a white body. The second candle opens with a gap down and closes above the middle of the first candle’s body.
The nearest significant resistance level is at the 7014.44 mark.
This level is formed by the Bearish Doji Star pattern. This pattern has a fairly high confirmation rate. It consists of two Japanese candles, where the second is a doji, which opens with a gap down.
Trading recommendations:
The latest signal on the chart indicates the prevalence of the long positions. This signal is valid, until the other pattern is formed.