S&P 500 closes the last trading session in the green zone, while the downward price movement vector prevails on the higher time-frame.
The support and resistance levels:
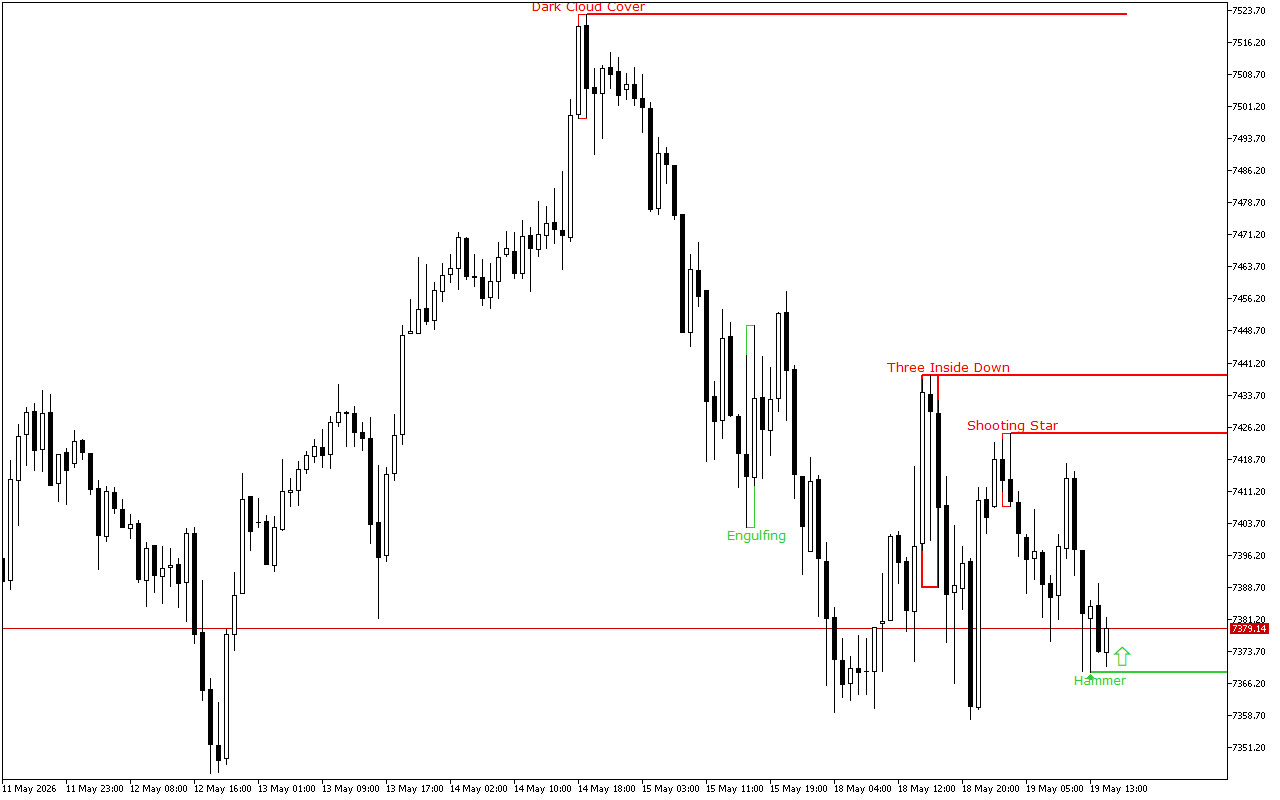
The nearest support is set at the 7368.76 mark.
This level was formed by the Hammer pattern, also known as the Pin Bar pattern. This pattern is represented with a single Japanese candlestick which is composed of a small real body and a long lower shadow.
The nearest resistance is set at the 7424.65 mark.
The level was formed by the Shooting Star pattern. This pattern is a single candlestick which is composed of a small real body and a long upper shadow. This pattern is usually called “Pin Bar” by traders.
Trading recommendations:
Despite the downward dynamics prevail on a higher time-frame, the long position should be prioritized intraday. The latest signal on the chart indicates the prevalence of the upward movement intraday.