During the previous trading session, the positive dynamics of the S&P 500 movement were seen. On a longer time-frame, the upward price movement vector also prevails.
The support and resistance levels:
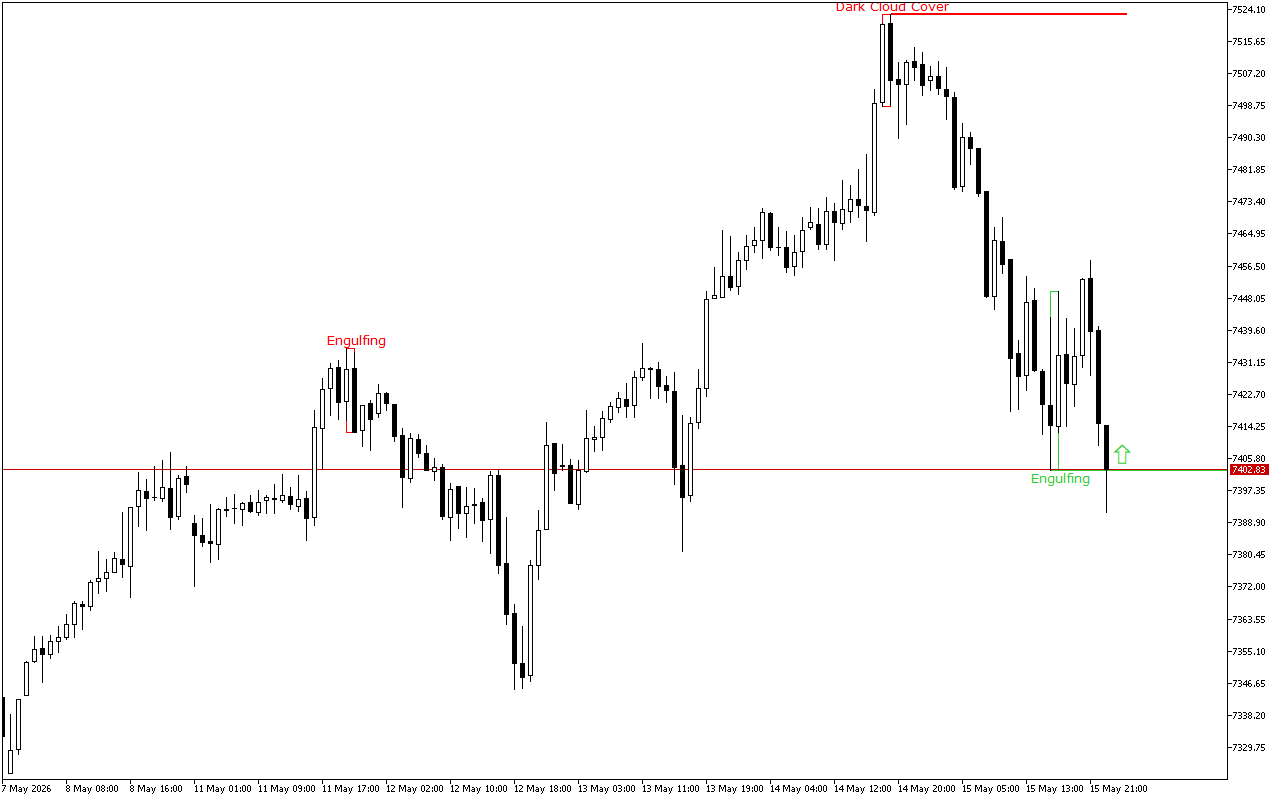
The current support level is in the area of the 7402.63 mark.
This level was formed by the Bullish Engulfing pattern. The pattern consists of two candles: the first one is inside the body of the second one, which is much larger. The second candle completely engulfs the first one.
The current resistance level is at the 7522.74 mark.
This level was formed by the Dark Cloud Cover pattern. The pattern consists of two candles: the first candle is long and white, and the second is black. The second one opens with a gap up and closes below the middle of the real body of the first candle.
Trading recommendations:
The price movement dynamics for a longer period of time as well as the latest signals on the chart indicate the long positions opening intraday. The entry points can be considered from the nearest support levels.