During the previous trading session, the price of S&P 500 decreased, moving in the main trend direction on the higher time-frame.
The support and resistance levels:
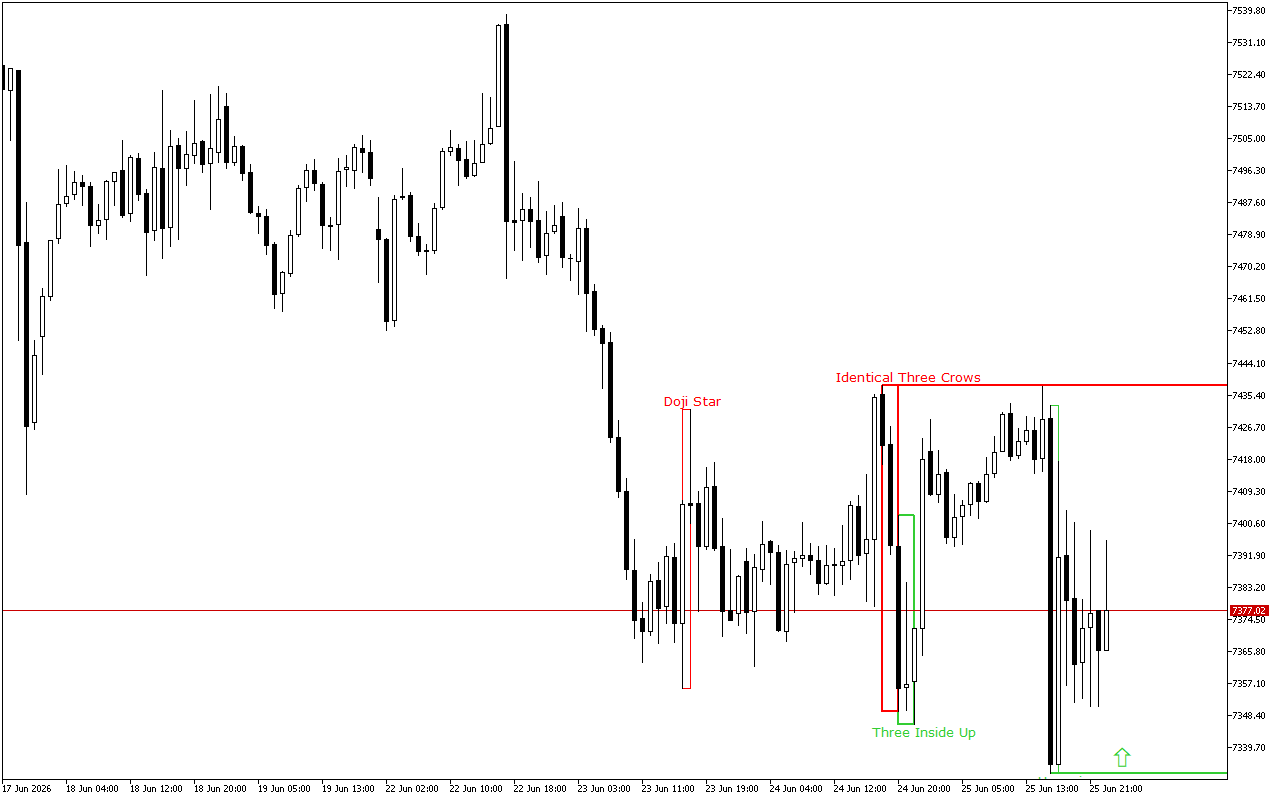
The nearest support level is at the price level of the 7332.7.
This level was formed by the Bullish Harami pattern. The pattern is represented with two Japanese candles, where the second one with a smaller real body is inside the body of the first one.
The nearest significant resistance level is at the 7437.87 mark.
As part of the formation of the level, the Identical Three Crows pattern was formed. This pattern consists of three consecutive Japanese candlesticks with identical long black bodies. Each candle opens at the closing level of the previous one and closes at a new low.
Trading recommendations:
The latest signal on the chart indicates the prevalence of the long positions. This signal is valid, until the other pattern is formed.