During the previous trading session, the positive dynamics of the S&P 500 movement were seen. On a longer time-frame, the upward price movement vector also prevails.
The support and resistance levels:
The closest support to the price is at the 7300.07 mark.
This level was formed by the Bullish Harami pattern. The pattern is represented with two Japanese candles, where the second one with a smaller real body is inside the body of the first one.
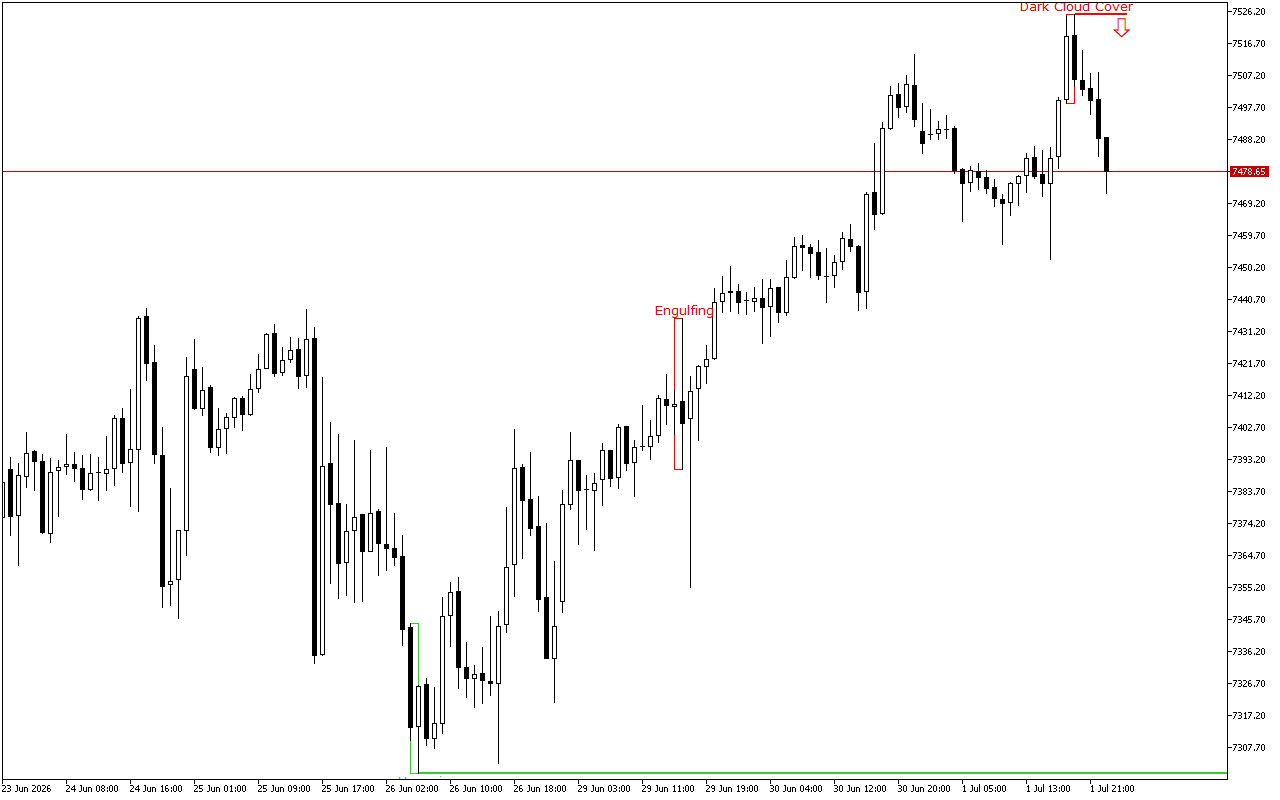
The nearest resistance level is at the level of the 7525.2.
This level was formed by the Dark Cloud Cover pattern. The pattern consists of two candles: the first candle is long and white, and the second is black. The second one opens with a gap up and closes below the middle of the real body of the first candle.
Trading recommendations:
The latest signal prioritizes short positions intraday.